Google Analytics is a powerful tool that can show you how your website is performing. By learning how to read these reports, you gain key information into your visitors' behavior, where your traffic is coming from, and how your marketing tactics are performing. This guide will teach you the basics of how to read a Google Analytics Report.
Understanding the Google Analytics Dashboard
When you first log into Google Analytics, you’re shown the dashboard, this is a bird’s eye view of how your website is performing. The information on the dashboard includes:
- Real-Time Data: Live data of users currently on your site.
- Audience Overview: Insight into the demographics, interests, and behaviors of your visitors.
- Acquisition Overview: How people are finding your website
- Behavior Overview: View how visitors interact with your site.
Navigating to Specific Reports
Google Analytics is organized into different report categories:
Audience Reports
These reports provide detailed information about your visitors.
- Demographics: Age and gender information.
- Interests: Users’ interests
- Geo: Geographical Location and language of your users
- Behavior: New or old visitors, frequency of views, and time spent on your site
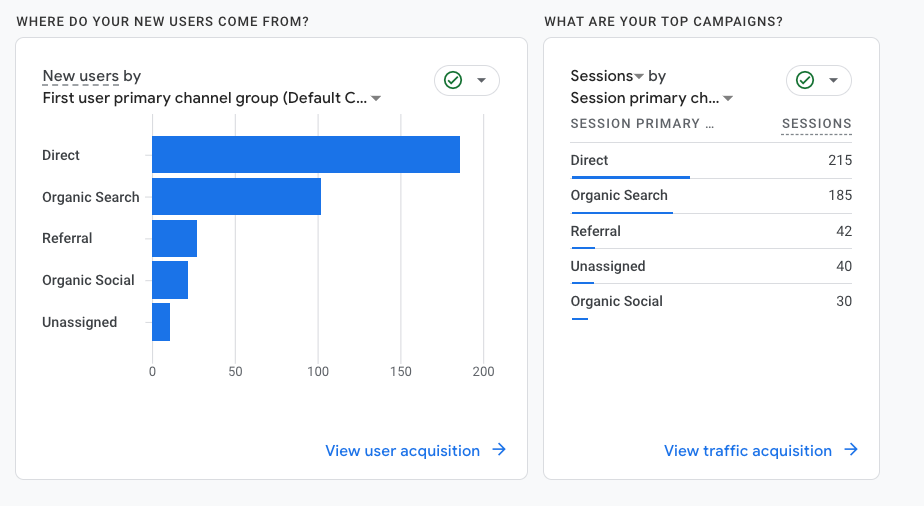
Acquisition Reports
These reports help you understand how users find your website.
- Overview: A summary of how users found your site
- Google Ads: Performance of your Google Ads campaigns.
- Social: Traffic from social media channels.
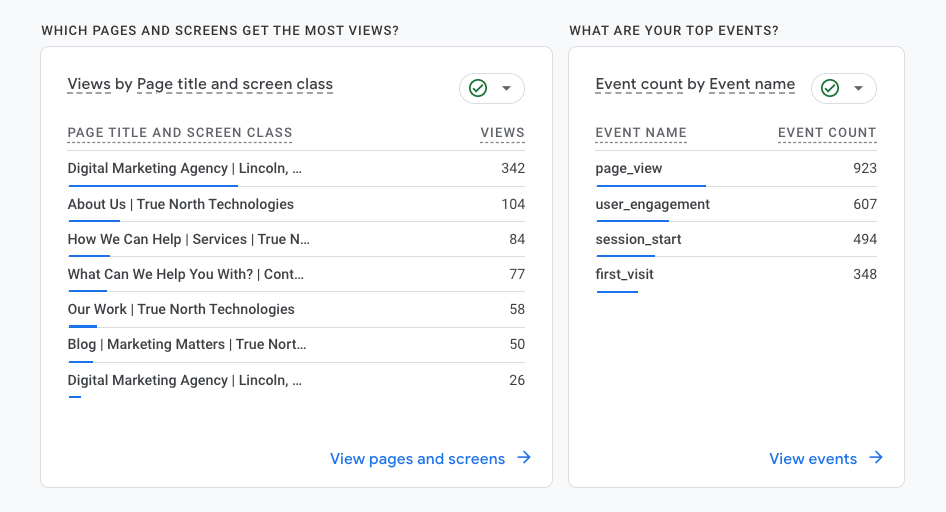
Behavior Reports
These reports show how visitors engage with your website.
- Overview: General behavior like page views, bounce rate, and average session duration.
- Site Content: Performance of each page.
- Site Speed: Loading times and how they impact the user experience
- Site Search: How visitors use your website’s search ability
Key Metrics to Focus On
When analyzing Google Analytics reports, pay attention to these key metrics:
- Users: Number of visitors.
- Sessions: Total visits to your site.
- Bounce Rate: Percentage of visitors who leave after viewing only one page.
- Average Session Duration: amount of time visitors spend on your site.
- Pages per Session: Average number of pages viewed per visit.
Interpreting the Data
Understanding the data is important for making educated decisions and setting SEO goals. Here are some tips:
- Identify Trends: Look for patterns over time rather than focusing on single data points.
- Compare Periods: Compare your data across different time periods to spot trends and see growth
- Set Goals: create and track goals to see your website’s success.
Conclusion
Reading a Google Analytics report can feel like you are reading a different language, but with experience, it becomes an important tool for increasing your website’s performance. By understanding the dashboard viewing key metrics, and interpreting the data correctly, you can crack the code on your insights that drive traffic to your site. For an in-depth tutorial or a custom Google Analytics report based on your personalized needs, reach out to the Google Analytics experts at True North Technologies!
Latest Posts